The problem
Every mainstream analytics tool works the same way: drop a script tag on the page, let it phone home to someone else's server, and hope an ad blocker doesn't strip it out along the way. That's three separate costs for one feature: an extra network request slowing the page down, a silent blind spot wherever the blocker wins, and a dataset that isn't actually yours. Glint was an attempt to see whether a page could be measured without any of that: no client-side script, no external request, no ad-blocker gap, and a database that sits under my own roof.
How it's built
Tracking in the middleware
The trick is where the capture happens. Next.js Edge Middleware runs on every request before the page is served, so if tracking lives inside the middleware itself, it happens server-side and no client-side JavaScript is ever shipped. The middleware pulls the URL path, referrer, user agent, country (from Vercel's geo headers) and timestamp off the incoming request, then writes an event to PostgreSQL with a lightweight insert.
Storing and querying events
Events land in a single table indexed on path, referrer, country and timestamp. Dashboard queries run time-bucketed aggregations (hourly, daily, weekly) using PostgreSQL's date_trunc, and the indexes keep those queries under 50ms even once the table holds millions of rows.
The dashboard
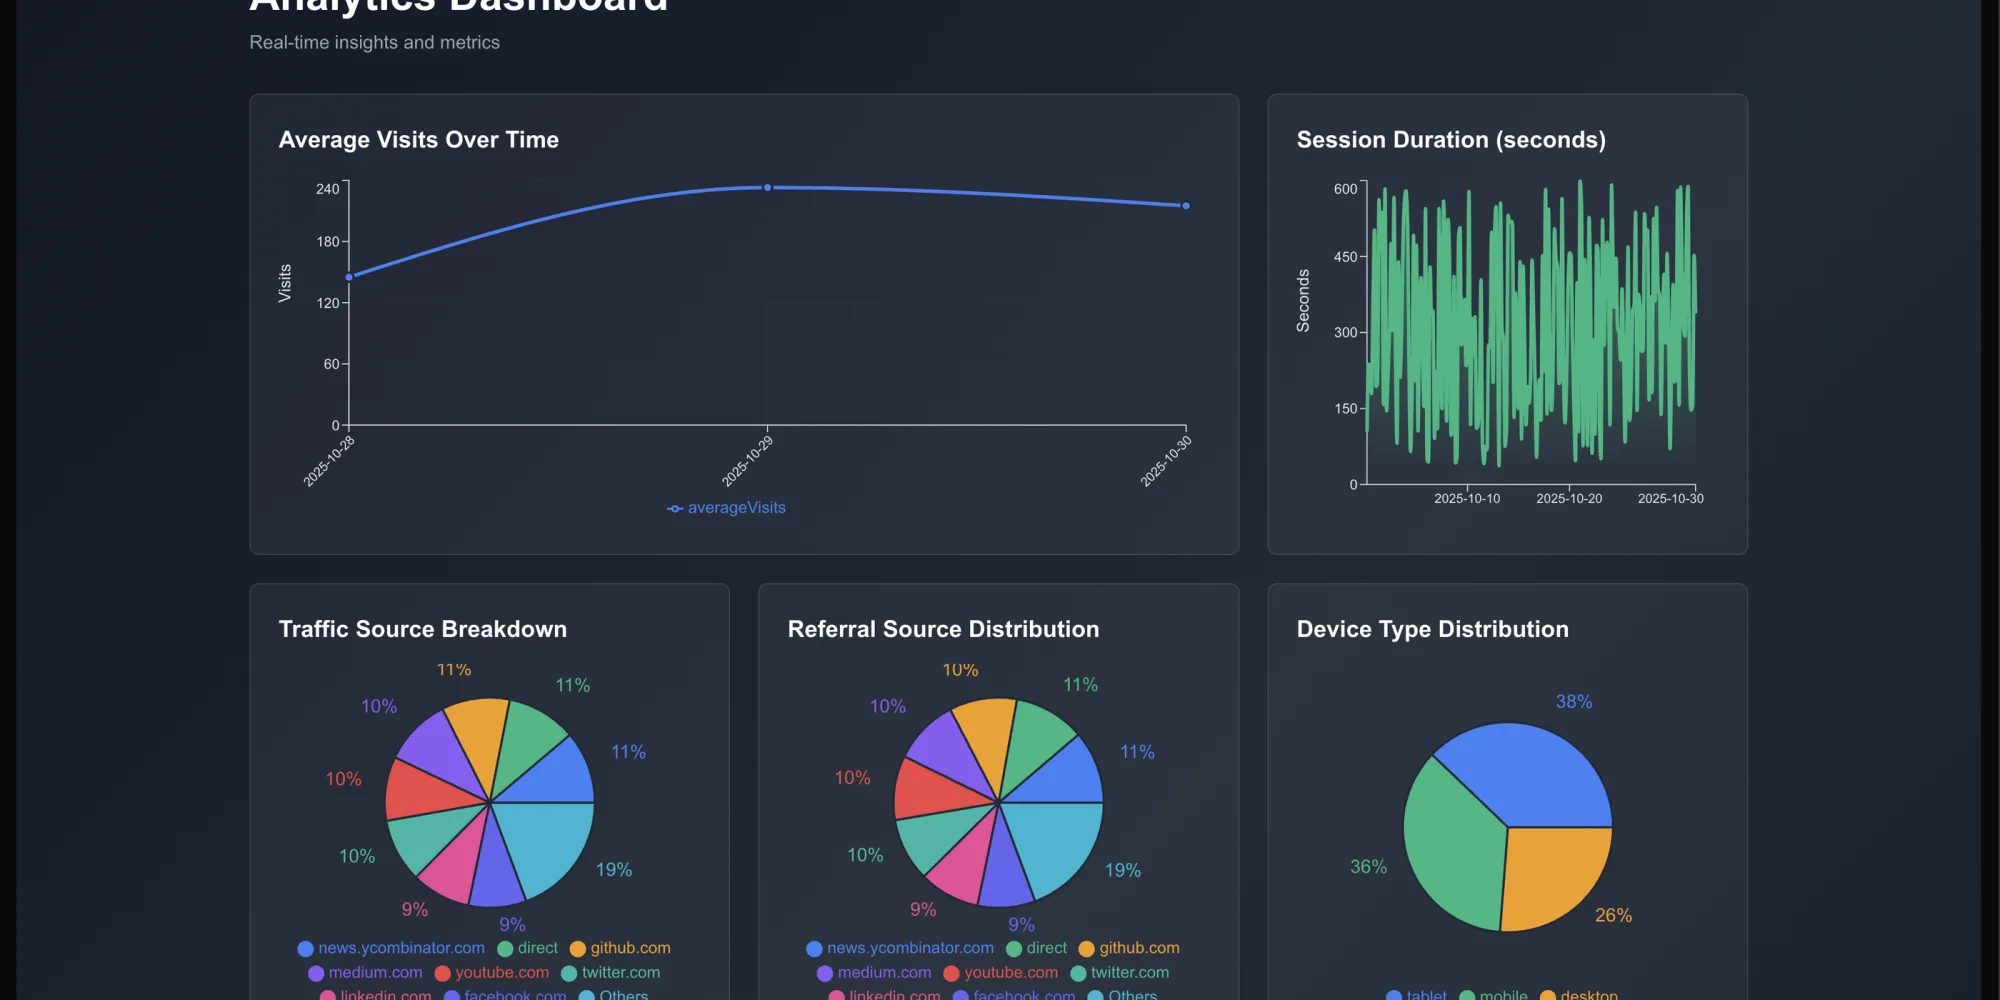
Recharts renders pageview trends, top pages, referrer sources and geographic distribution, all fed by API routes that run the aggregation queries against the events table. It refreshes every 60 seconds in development and has a date range picker for looking back further.
Faking traffic for the demo
A live personal-site dashboard with almost no visitors isn't much of a demo, so a Cloudflare Worker cron job sends simulated traffic from global edge locations at regular intervals. It varies paths, referrers, countries and timing enough that the dashboard looks like it's reading a real audience even when it isn't.
Trade-offs along the way
Middleware runs on every request, which means any slowness there becomes slowness everywhere. The fix was to make the database write fire-and-forget: the middleware doesn't await the insert before letting the response continue, and a connection pool means it's never opening a fresh database connection per request. Net effect on page load: nothing measurable.
Once that pipe was open, it captured everything indiscriminately, including search engine crawlers, uptime checks and monitoring bots hitting the site on their own schedules. The middleware now filters known bot user agents and excludes internal paths like /_next and /api from the event stream, which gets the numbers a lot closer to actual human traffic.
The last problem only shows up at scale: a busy site produces millions of rows, and none of that is useful to keep forever at full resolution. Tables are partitioned by month, and a nightly job deletes raw events older than 90 days while leaving the daily aggregates untouched. Long-term trends survive; the raw log doesn't bloat the database.
Outcome
Glint gives complete analytics with no client-side overhead: pages load exactly as fast as they would without any tracking at all, ad blockers have nothing to catch, and every row of data sits in a database I control. The dashboard covers what's actually needed to read traffic patterns, without the third-party privacy trade-off that comes bundled with the usual tools.